Beginner Tutorial
This is intended as a fast, but not too furious, introduction to the Bento system. You’re going build a functional, interactive dashboard in a matter of minutes. Not to worry, you will be handed all of the pieces you need with instructions on where they go and a brief explanation of how the pieces fit. And, each step will give a visual result which you can check against some of the checkpoint images. The goal is to convey the fundamentals of the system without going into details.
As a straightforward example, let’s build a dashboard that visualizes historical stock
prices for a few large tech companies. As perhaps one of the most commonly experienced
chart types in the world, most people should have some idea of what to expect here. You
can see what we’re gonna end up with by running $ bento-demo and clicking to the
stock page on the app bar. (Make sure you’ve followed the Bento Quickstart)
- We can break this project up into four stages:
Plan the basic features
Prepare the data we are using
Set up our Bento dev environment
Write the descriptor (which we’ll break out into pieces)
Note
For the foreseeable future (how long is that, really?), only ‘Nix environments are gonna be supported (namely Mac and Linux) so we’ll take some liberties in assuming that.
Features
What should our dashboard do? It’s a tough question if you are trying to predict the end product–there are a lot of unknowns (Who is the target user? What interactions will work well? Will the dashboard get cluttered? What does Bento even support doing?) so let’s just try to start with a good first draft. We’d like to at least be able to plot comparative traces of stock gains. For this, we’ll need the ability to select the ticker symbols to show. A way to choose a period in time for comparison would also be useful. Lastly, we would also need a way to normalize the prices into percentage gains from the start of our interval.
- This translates into 4 total Bento banks:
A
selector– a multi-selection dropdown tied stock ticker symbolsA
date_control– a two-sided slider bar, letting one choose a date intervalAn
analytics_set– a toolkit that contains a normalization optionLastly, a standard
graphfor the plotting of the time series
Data
Bento leaves the data preparation to the user, by design. But for this example, we will simply use the sample stock dataset packaged with Bento (I suppose it is a stock stock dataset…apologies). Not only is this data prepared, but it is also supplied in the expected structure:
{
    "df": your_dataframe_object,
    "keys": ["key_column_1", "key_column_2"],
    "types": {"measurement_column_1": int}
}
The structure above contains the data as a Pandas DataFrame and adds descriptive info: identifying the columns that are keys (which help locate rows of interest) and for those that contain metrics with their types (usually date, float, int). The metadata helps Bento supply automated defaults, helping ensure your app works right away. For example, sample stock data metadata looks something like
{
    "df": <the DataFrame object>,
    "keys": ["symbol"],
    "types": {"open": float, "close": float, "volume": int}
}
Can you guess how Bento incorporates this?
Note
Exploring a sample dataset is straightforward, for example try:
>>> from bento.sample_data import stock
>>> dataset = stock.load()
>>> print(dataset['df'])
Ultimately, Bento requires a module that can be imported to load the data. So in
this case that is bento.sample_data.stock, which we’ll use shortly!
Environment
Now that you’re palpably excited from visualizing the dashboard, it’s best to channel some
of that energy into setting up your development environment. This will save a lot of
time and headache down the road. I recommend going through the Quickstart steps
at the Bento Builder repo.
Make sure $ ./build.py simple_example -dbu works, because we’ll be using the
same flags.
Once that is done, make a new directory called beginner and open a new file
descriptor.py for editing in your favorite editor:
$ mkdir beginner
$ vi beginner/descriptor.py
Note
If you want some extra credit, add a version file to avoid a later warning
$ echo ‘__version__ = “0.0.1”’ > beginner/_version.py
Descriptor
And now for the main course, let’s write the Bento descriptor. This is the piece that really ties the room together.
Step 1
We’re going to start with the most basic, functional skeleton to start. This entails declaring the data source (the stock sample data, as above) and defines a single page containing a single bank (of type “graph”).
# beginner/descriptor.py
descriptor = {
    "data": {"stock": {"module": "bento.sample_data.stock"}},
    "pages": {"main_page": {"dataid": "stock", "banks": {"traces": {"type": "graph"}}}}
}
This should get us a graph that displays our DataFrame blindly. Go ahead and paste that into the descriptor file. Now you can run the build script:
$ ./build.py beginner -dbu
And if all is good, you can go to localhost:7777 and see something (ugly) like this:
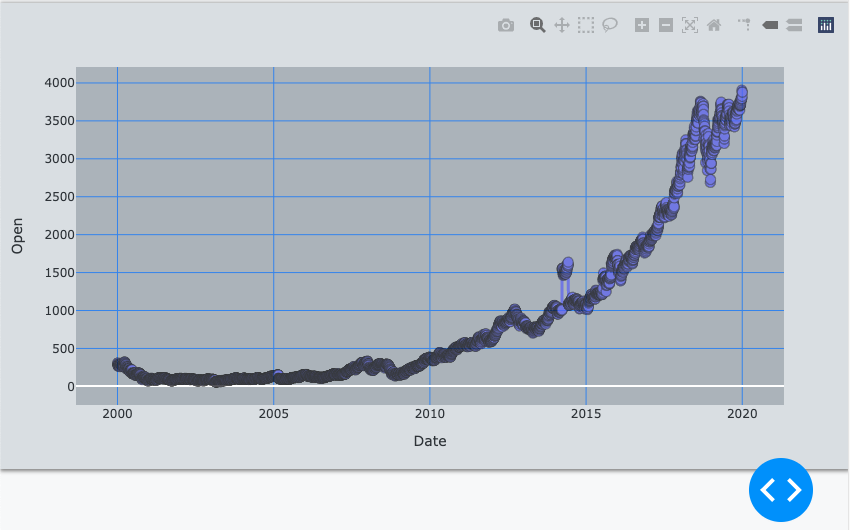
Don’t worry, this will clean up pretty quick.
- So here’s what’s important to know about what we did:
We named the key in
datasomething unique and relevant (“stock”)The key matches the value of the
dataidfor our pageThe
modulefor our data entry is set to the sample dataOur page has a
bankskey with a valid dictionary of our single bankThe
main_pageandtracesstrings just represent unique names we can make up
Step 2
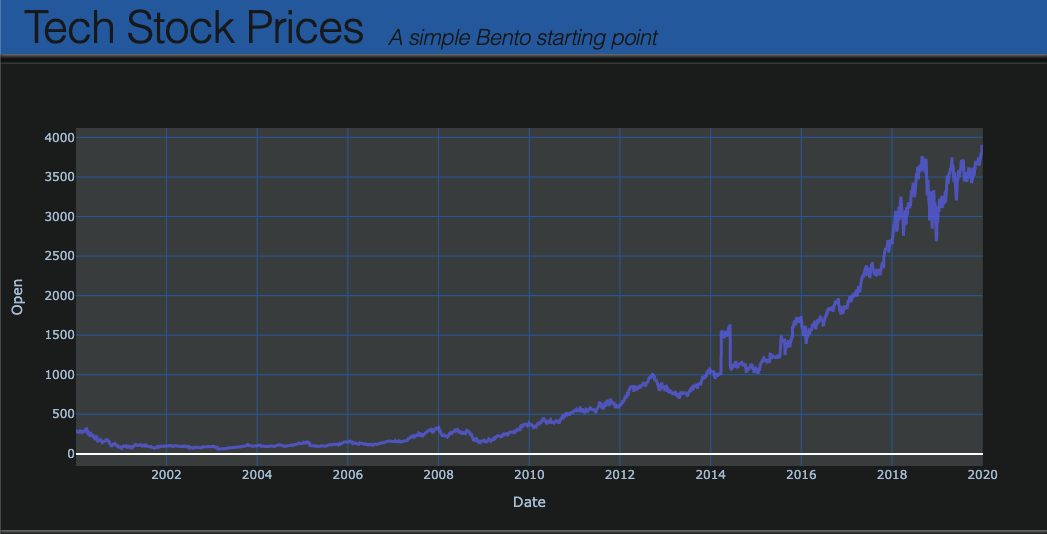
- Let’s add a few quick aesthetic improvements:
Add an
appbarto the descriptor, which sets a title/subtitle and contains any nav linksChange the theme to
darkSet the graph trace mode to lines
Also let’s break out the page definition from the main dictionary
Try them in any order by looking at the completed version below:
# beginner/descriptor.py
main_page = {
    "dataid": "stock",
    "banks": {
        "traces": {"type": "graph", "mode": "lines"},
    },
}

descriptor = {
    "name": "beginner_tutorial",
    "theme": "dark",
    "appbar": {
        "title": "Tech Stock Prices",
        "subtitle": "A simple Bento starting point",
    },
    "data": {"stock": {"module": "bento.sample_data.stock"}},
    "pages": {"main": main_page},
}
The full result should look like:
Step 3
Now let’s start cooking with gas. First, we’ll add all the banks we had planned. Simply
add these lines to the banks dict:
"analytics": {"type": "analytics_set"},
"interval": {"type": "date_slider", "variant": "range"},
"symbols": {"type": "selector", "columns": ["symbol"]},
You should now get some new blocks showing up, but they aren’t very well-organized. As in, they are just stacked on top of each other, rather lazily. We can fix that by supplying a layout. This should be intuitive, just add this to the page dict and see if it makes sense:
"layout": [["symbols", "interval", "analytics"], ["traces"]],
Currently, Bento expects a 2-D array of bank IDs, but a generalization to N-D could be in the cards.
Perhaps you’re also frustrated that these don’t do anything yet. That’s because we haven’t told the app to connect the banks. This part is, I think, delightfully straightforward–just define the many-to-many graph of connections between banks. In this case, it’s just the following new dictionary keyed into the page:
"connections": {
    "analytics": {"traces"},
    "interval": {"traces"},
    "symbols": {"traces"},
},
Now stuff should happen. And there was much rejoicing. If not, double-check against the full descriptor below
See the full descriptor
main_page = {
    "dataid": "stock",
    "banks": {
        "traces": {"type": "graph", "mode": "lines"},
        "analytics": {"type": "analytics_set"},
        "interval": {"type": "date_slider", "variant": "range"},
        "symbols": {"type": "selector", "columns": ["symbol"]},
    },
    "layout": [["symbols", "interval", "analytics"], ["traces"]],
    "connections": {
        "interval": {"traces"},
        "symbols": {"traces"},
        "analytics": {"traces"},
    },
}

descriptor = {
    "name": "beginner_tutorial",
    "theme": "dark",
    "appbar": {
        "title": "Tech Stock Prices",
        "subtitle": "A simple Bento starting point",
    },
    "data": {"stock": {"module": "bento.sample_data.stock"}},
    "pages": {"main": main_page},
}
